The problem
Everybody wants a map. Poll workers need to see where their precinct is. The front counter needs a wall map for voters who walk in. Communications needs an early voting map for the website by Friday. The district maps on the wall are two redistrictings old. Making each one by hand means hunting for the right files, figuring out why the roads land a mile from the precinct lines, and building a title block, legend, and scale bar from scratch. If you do this a few times a year, you relearn it every time.
The prompts
Start in a folder
…\AI Projects\Election Maps\
Make the folder
On your C: drive, OneDrive, or an external drive. Your choice.
Open it in the app
Claude: Code tab → under the message box, choose Local → Open folder… ChatGPT: open Codex, click Add new project (or press Ctrl+O), then pick the folder. To add more folders later, open the project menu, choose Edit project, then Add folder.
Say what you want
Use the prompt below. Then open what it saved in the folder.
Say them out loud or type them. Change the words to fit your office. The AI goes and gets the public documents itself and saves what it makes in the folder.
Prompt 1 · Say it or type it
Build the wall map
This folder is my maps project. Make a 36 by 48 inch wall map of [Your county] County precincts and polling places for our plotter.

Go get the public shapefiles yourself. Get our precinct boundaries and polling places from our office's website or the county's GIS open data site, city limits from the county or city GIS sites, and roads, water, and the county line from the Census Bureau's TIGER/Line files. If sources disagree, tell me which one you used and why. Save the downloads in a data folder with a sources file listing each link, who published it, and the data date.

QGIS is installed on this computer. Build the map as a QGIS print layout and save the project, so I can adjust it by hand. Export a PDF for the plotter and a small preview image. Put on a title, the map date, a legend, a north arrow, a scale bar, a polling place list down the side that's readable from 3 feet away, and source credits, plus the line "For reference, not an official boundary determination."
Fill in anything in [brackets] with your own details.
The first time, the AI may ask before each download or script. Read what it’s asking, then say yes.
Prompt 2 · Say it or type it
Fix what's off
Precinct 12's number is jammed into a corner of its narrow strip, and Precinct 30's number landed out in the water. Move both to the middle of their precincts, on land, and export the PDF again.
Prompt 3 · Say it or type it
Remember this for next time
Save a short instructions file in this folder so you remember where our data comes from, how our maps are laid out, and that this project uses public data only.
How I do it
I keep a dedicated Claude Code project just for maps. It knows where to pull public shapefiles: county and city GIS departments, and the Census Bureau’s TIGER/Line street centerlines and boundaries. It works with QGIS installed on my computer when a map needs a real print layout, and it produces large-format maps for our plotter.
The project is one subfolder inside the main folder where I keep all my Claude Code work. Its CLAUDE.md file (a short instructions file that Claude Code reads at the start of every session) lists the data sources and how our maps are laid out, so I don’t have to repeat them. The third prompt above asks the AI to write that file for you. I use an isolated AI workstation, a standalone computer that isn’t on the county network, and only public data goes into the maps folder. See Safe Setup for how that kind of setup works.
New to GIS terms like shapefile and projection? Read GIS basics in plain language first. It takes five minutes.
What you need
- The Claude desktop app (Code tab) or the ChatGPT desktop app (Codex) and a folder called something like
Election Maps. Put it on the C: drive, OneDrive, or an external drive. Keep voter files out of it entirely. - QGIS, the free desktop mapping program, from qgis.org/download. Pick the long-term release (LTR). Installing software may need your IT staff’s approval.
- Your office’s detailed precinct GIS file and polling place layer. Florida law requires each supervisor of elections to keep a GIS map of current precinct and district boundaries (s. 101.001(3)(a), F.S.). That map is your most trusted source. The layer behind an interactive map on your website is usually simplified for the web, so for a plotted map, save the detailed file in the folder and tell the AI to use it.
- Your plotter’s widest roll size and a test printer for proofs.
- A second person who knows the precincts to check the map before it goes on a wall.
Step by step
- Make the folder. In File Explorer, create
Election Maps. - Open it in the app. In the Claude desktop app, open the Code tab, and in the row under the message box choose Local, then Open folder…. In the ChatGPT desktop app, open Codex, click Add new project (or press Ctrl+O), and pick the folder. The full walkthrough is on Folder projects.
- Say the prompt. Speak it or type it. Change the size to fit your plotter.
- Read the sources file before you trust any layer. Each link should be on the publisher’s own site (a .gov, county, city, or university address), not a copy someone reposted.
- Open the QGIS project it saved and look over the whole map. You know your precincts, so a missing number, a boundary in the wrong place, or a polling place on the wrong street will stand out. Does the precinct count match your official list? Do the roads sit on top of the precinct lines? Fix anything that looks crowded. Moving a label by hand is often faster than asking.
- Ask for fixes in plain words (the second prompt is an example). Then print a small test copy and check the title, dates, reference line, precinct numbers, and every polling place in the side panel.
- Have a second person check it against the official precinct and polling place lists. Then run the full-size plot.
- Save the instructions file with the third prompt, so the next map starts from the same sources and layout.
One possible outcome
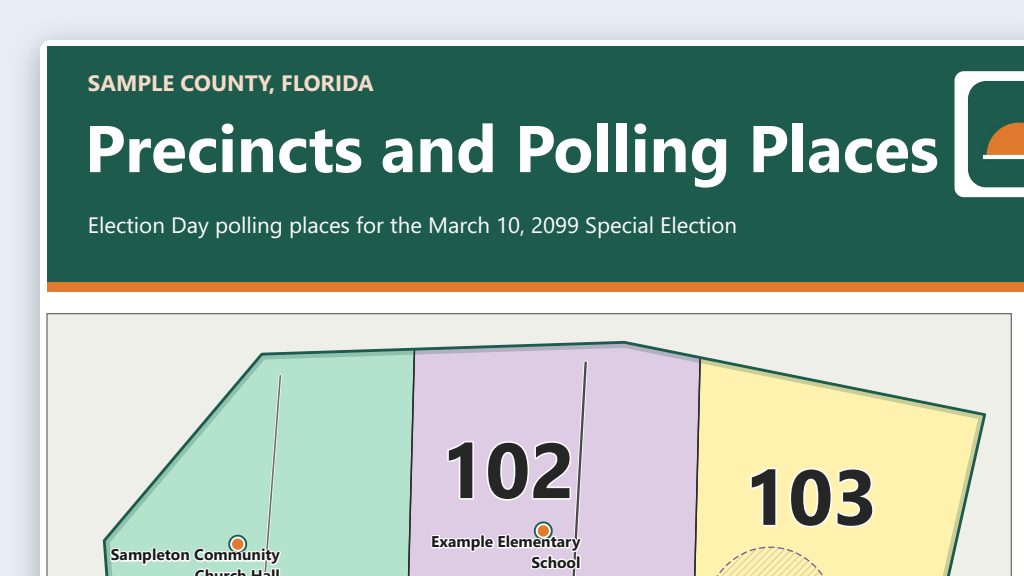
One run of the first prompt, for a made-up Sample County, with fictional map layers.
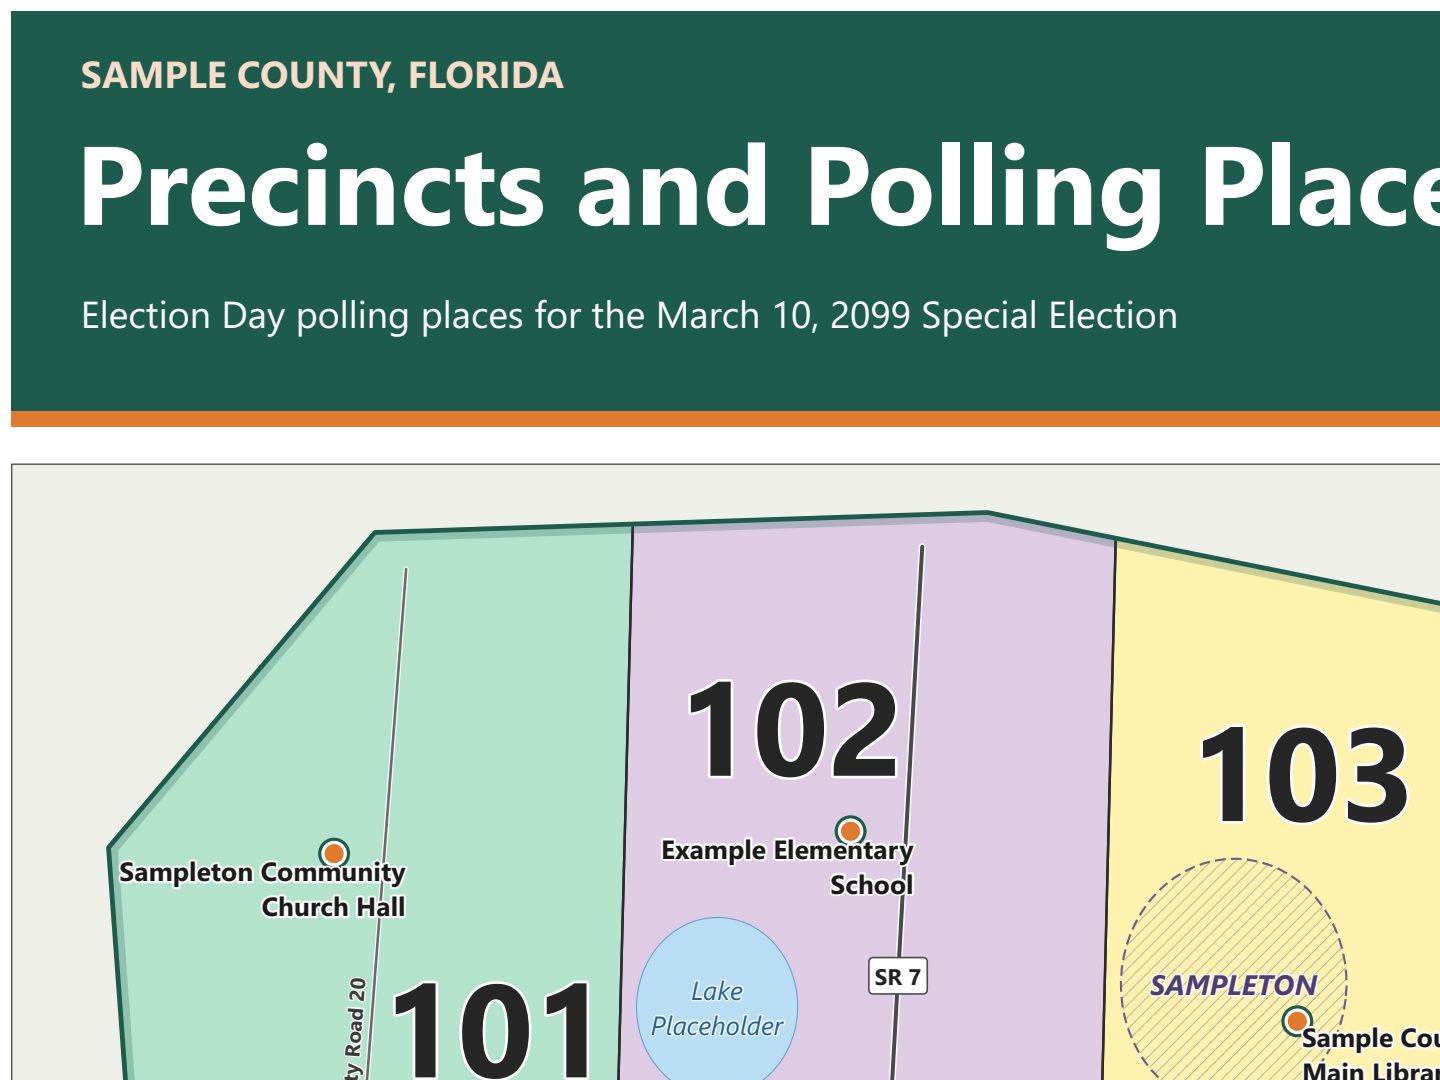 (opens the full version, PDF, 36 × 48 in, 210 KB)
File names end in -DRAFT because AI output is a draft until a person checks it. Web addresses shown in these samples are made-up and will not open.
Make it yours
- District maps. Ask for county commission, school board, city council, state legislative, or congressional districts instead of precincts. Tell the AI to get each one from the body that adopts it and to put the plan name and adoption date in the credits. The Census Bureau’s 2025 congressional district file shows the districts drawn before Florida’s 2026 congressional map (Chapter 2026-229, Laws of Florida), so get current district files from the Legislature and confirm which plan applies to the election you’re mapping.
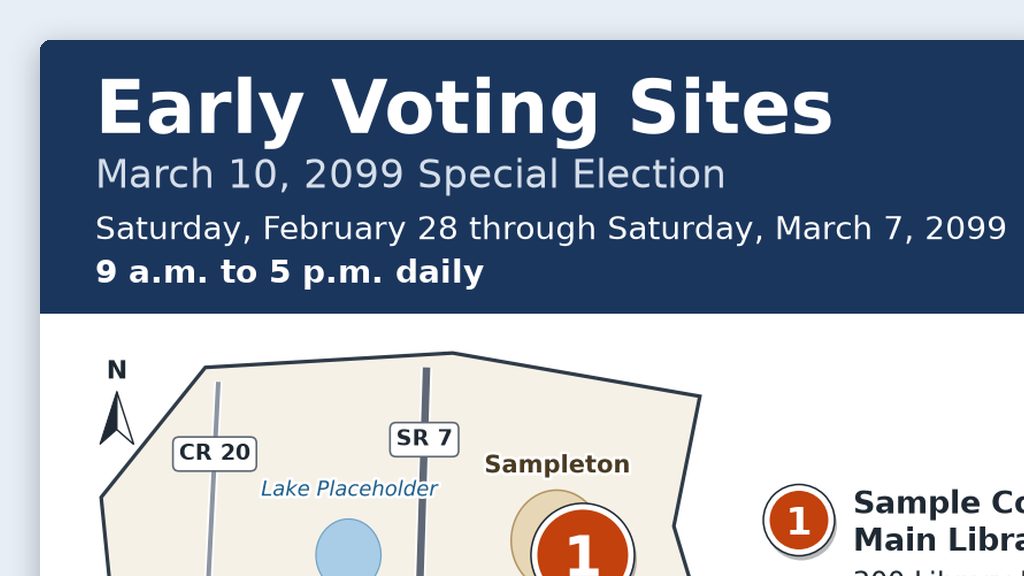
- Early voting and drop box maps. Use the same folder for the base map, then follow the web maps use case for the text list and alt text.
- Shading by published totals. Color precincts by published turnout or registration counts. Tell the AI where the published report is, and have it match each row to its precinct by precinct number. You know which precincts run high and low, so shading that looks wrong will stand out. Check those against the report.
- Parcel layers. The property appraiser’s parcels include owner names. Use them for shapes only, and never label owners on an election map.
Why this works
- The instructions file remembers the sources and the layout, so every map starts from the same trusted data and carries the same labels.
- The sources file is your audit trail. If someone asks where a line came from, you can answer with a link and a date.
- QGIS keeps you in control. The AI builds the first draft of the layout, but you can open the project and change anything by hand.
Time: by hand vs. with AI
By hand
1–2 days per map
AI’s part, measured
About 1 hour
in a test run of these prompts
With AI
2–4 hours
your time, including review
About the measured time: “AI’s part” is how long the AI took, start to finish, in a test run of these prompts on September 27, 2026. It works on its own while you do something else. “By hand” and “With AI” are estimates of your own time.
Honest estimate, not a measurement. Most of the old time went to finding data, fixing coordinate systems, and building the layout by hand. The AI does that part quickly. Most of the 2–4 hours is you checking every boundary, label, and polling place before anything prints. The first map takes the longest; later maps reuse the same folder, sources, and layout.
Checking the work: what an expert looks for
You know this work, so you’re the best person to check it. Open every file it made and read every page. If part of it is outside what you know, hand that part to someone who knows it. These are the spots that most often need a fix:
- Check the precinct count and every precinct number against your office’s official precinct list. A layer on an open data site can be a version behind after a precinct change. In one real run, the county’s open data layer was three years old and missing two new precincts.
- Census 2020 voting districts are a 2020 snapshot, not your current precincts. Never label them as current.
- If layers don’t line up, or the scale bar looks wrong, a layer is in the wrong coordinate system. Tell the AI which layer is off and have it reproject that layer. Never nudge a layer into place by hand.
- Check every polling place marker. Points made from an address often land on the road or the middle of a parcel, not the building. Use your office’s own polling place layer when you have one.
- Print a small test copy before the full-size plot. It’s cheaper to catch a typo on letter paper.
Last reviewed October 2, 2026.