Maps answer questions voters and staff ask every day. Which precinct am I in? Where do I vote? Which commission district is this? This section shows how to make those maps from public data, with free software and an AI app on your computer doing the tedious parts in a project folder.
GIS (geographic information system) means software and data for making maps from real locations. Your office already has the most important GIS data. Florida law requires every supervisor of elections to keep a GIS map showing the current boundaries of each precinct and each district in the county (s. 101.001(3)(a), F.S.).
Use cases in this section
 One possible outcomeGreen data classification· Public data
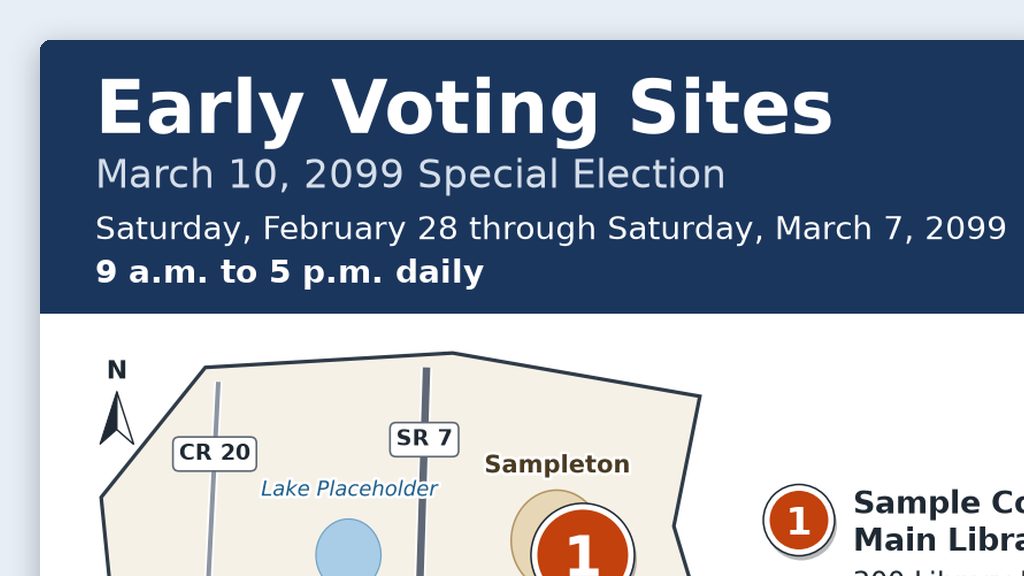
Web and social media maps for early voting and drop boxes
Put your approved site list in a folder and get back a numbered map image, a text list with addresses and hours, alt text, and a caption that all match.
- By hand
- 2–3 hours
- With AI
- 45 minutes
Ready for a full wall map, built in QGIS and printed on your plotter? Precinct and polling place maps is in Advanced Projects.
Three rules for every election map
- Label it “For reference, not an official boundary determination.” Leave the line off only when your office has certified the map. Put it on the map itself, not just on the web page around it, because maps get saved and shared on their own.
- Official boundaries come from your office and the bodies that adopt them. The county commission creates and changes precincts on the supervisor’s recommendation (s. 101.001(1), F.S.), and your office keeps the official precinct map. District lines come from the body that adopts them, such as the county commission, a city, or the Legislature. Census files and statewide libraries are fine for background layers and for checking, but they’re not the final word.
- Aggregate data only. Show places (polling places, early voting sites, drop boxes, offices) and totals by precinct or district. Never plot individual voters on a published map, and never put a voter list in an AI project folder or send it to an AI tool to map it.
GIS basics in plain language
What a shapefile is
A shapefile is the most common format for map data. Despite the name, it’s a set of files with the same name and different endings. They only work together:
- .shp: the shapes themselves (points, lines, or areas)
- .shx: an index that helps software find each shape quickly
- .dbf: a table of facts about each shape, like a precinct number or a road name
- .prj: the coordinate system (explained below)
Census Bureau shapefiles also include a .cpg file (which tells software how the text is encoded) and a couple of metadata files. Shapefiles usually arrive as one .zip file. Unzip it and keep the whole set together in one folder. If you send someone only the .shp file, it won’t open.
Each file like this is called a layer: one kind of thing, such as all the precincts, all the roads, or all the polling places. A map is several layers stacked on top of each other.
You’ll also see two newer formats:
- GeoPackage (.gpkg): a single file that can hold many layers. Easier to share than a shapefile set.
- GeoJSON (.geojson): a text format that web maps use. Fine for small layers; large files get slow.
Projections and coordinate systems
The earth is round and paper is flat. A coordinate system (you’ll also hear projection or CRS) is the math that flattens part of the earth onto a flat map. Every GIS layer is stored in one. When two layers use different ones, they won’t line up until software converts one to match. That conversion is called reprojecting. For printing and measuring, put every layer in the same coordinate system.
What you’ll see on Florida maps:
- Florida State Plane. Florida has three zones: East, West, and North. Each county falls in one. For example, Brevard, Duval, Orange, Palm Beach, and Volusia are in the East zone. Hillsborough, Pinellas, and Polk are in the West zone. Alachua, Escambia, and Leon are in the North zone. County GIS departments often use their zone, measured in US feet.
- UTM zone 17N. Covers Florida east of 84° west longitude (roughly everything east of Tallahassee). Measured in meters. Some statewide data uses it.
- Latitude and longitude. Census TIGER/Line files come this way. Good for storing data, not for measuring. Reproject before you print.
- Web Mercator. What most online maps use. Fine for web images; not for measuring.
Every coordinate system has an EPSG code, a number that names it exactly. QGIS shows these codes, so it helps to recognize a few:
| Coordinate system | EPSG code | Units |
|---|---|---|
| NAD83 / Florida East (ftUS) | 2236 | US survey feet |
| NAD83 / Florida West (ftUS) | 2237 | US survey feet |
| NAD83 / Florida North (ftUS) | 2238 | US survey feet |
| NAD83(2011) / Florida East (ftUS) | 6438 | US survey feet |
| NAD83 / UTM zone 17N | 26917 | meters |
| NAD83 (latitude and longitude) | 4269 | degrees |
| WGS 84 / Pseudo-Mercator (web maps) | 3857 | meters |
Where to find public GIS data
Your own office. Start with the precinct and polling place layers your office keeps (s. 101.001(3)(a), F.S.). These are the official precincts. The law lets supervisors coordinate with other government agencies on this map, so in many counties the county GIS department does the technical work. Ask who maintains yours.
County and city GIS open data sites. Many Florida counties and cities publish GIS data online: roads, city limits, commission districts, parcels, and more. Search for “[your county] County GIS open data.” Watch out: city limits change with annexations, so check the “last updated” date. Parcel layers include owner names; use them for shapes only.
U.S. Census Bureau TIGER/Line Shapefiles. Free nationwide layers: roads (street centerlines), water, city limits, county lines, school districts, and legislative districts. As of September 26, 2026, the newest set on the TIGER/Line page is the 2025 set, released September 23, 2025, with boundaries as of January 1, 2025. Check for a newer year before you download. Florida’s state code in Census file names is 12. Watch out: Census district files lag behind. The 2025 congressional district file shows the 119th Congress districts, drawn before Florida’s 2026 congressional map.
Census 2020 voting districts. Voting district (VTD) is the Census Bureau’s general term for precincts, wards, and election districts. For the 2020 Census, states in its redistricting program sent their voting district boundaries to the Census Bureau. Florida’s are posted county by county, plus one statewide file, in the 2020 redistricting files. Watch out: they’re a 2020 snapshot. Precincts often change after redistricting and as counties grow, so 2020 voting districts may not match your current precincts. Never label them as current. They’re useful for demonstrations, history, and comparison.
Florida Legislature: state legislative and congressional districts. The Florida Senate’s Maps & Statistics page has shapefiles for current and past plans. Pick Congressional, State Senate, or State House from the menu. Congressional districts changed in 2026: the Legislature passed a new plan (HB 1-D) on April 29, 2026, and it was signed into law on May 4, 2026. The shapefile is on the Senate’s congressional redistricting page. The Legislature’s floridaredistricting.gov site holds material from the 2022 redistricting cycle. Watch out: confirm with your office which plan applies to the election you’re mapping. A 2022 congressional file is out of date.
Florida Geographic Data Library (FGDL). fgdl.org is run by the University of Florida’s GeoPlan Center with support from the Florida Department of Transportation. It has more than 600 statewide layers, including roads, water, land cover, and boundaries. Watch out: check each layer’s date and notes. A statewide layer can be older than your county’s own version.
QGIS: free, and worth installing
QGIS is free, open-source mapping software for Windows, Mac, and Linux. Open source means the program’s code is public and nobody charges for a license: no per-seat fees and no renewals.
Why it’s worth installing in an election office:
- It opens the common formats (shapefiles, GeoPackage, GeoJSON) and handles coordinate systems for you.
- Its print layout tool adds a title, legend, north arrow, and scale bar, and exports a PDF your plotter can print.
- It has Python built in, so Claude Code (the Code tab in the Claude desktop app) can write scripts that build maps in QGIS, right in your project folder. You can still open the result and change anything by hand.
- It has a large user community and free documentation.
The trade-offs are real. There’s a learning curve, and your first map will take a while. New versions come out often. And if your county GIS department uses Esri’s ArcGIS (paid software), you’ll want them to export the layers you need as shapefiles or GeoPackage files.
Which version? As of September 26, 2026, the QGIS download page lists QGIS 4.2 as the latest release and 3.44 “Solothurn” as the long-term release (LTR). QGIS describes the LTR as the choice for people who value “stability over having the latest features,” and suggests the LTR if you’re not sure. For most offices, that’s the right pick.
Map types for elections
| Map | Who uses it | Usual format | Main layers |
|---|---|---|---|
| Precinct and polling place map | Front counter, poll workers, candidates | Wall map and PDF | Precincts, polling places, roads, water |
| Early voting site map | Voters | Web image plus a text list | Early voting sites, county outline, major roads |
| District maps (commission, school board, legislative, congressional) | Candidates, voters, staff | Wall map and PDF | District lines, precincts, city limits |
| Drop box (secure ballot intake station) map | Voters | Web image plus a text list with hours | Drop box sites, county outline, major roads |
| Poll worker assignment map | Poll worker staff and trainers | Letter or tabloid PDF | Polling places with staffing counts (never where workers live) |
| Wall maps for the office | Staff and visitors | Plotter print, such as 36 × 48 inches | Any of the above |
| Web and social media maps | Website and social media followers | Phone-sized image, alt text, and a text list | A few simple layers |
Your first map in an afternoon
A checklist for your first precinct map, by hand in QGIS. Claude Code can do most of these steps for you (see Let the AI do the legwork below), but doing it yourself once teaches you what to check.
- Get IT’s OK to install QGIS on the right computer.
- Install the QGIS long-term release (LTR) from the download page.
- Get your office’s current precinct layer and polling place list. Ask which coordinate system they use.
- Download your county’s roads and water from TIGER/Line. Unzip each file into its own folder.
- Start a new QGIS project and set its coordinate system to match your precinct layer.
- Drag in the precinct, roads, and water layers. If they don’t line up, fix the coordinate system before you go on.
- Style it: pale precinct fills, precinct number labels, and polling places as numbered points.
- Make a print layout with a title, map date, legend, north arrow, scale bar, sources, and “For reference, not an official boundary determination.”
- Export a PDF and print it on letter paper.
- Have someone who knows the precincts check it against the official list.
Let the AI do the legwork, in a folder
I keep a separate Claude Code project just for maps. It pulls public shapefiles, works with QGIS on the same computer, and turns out large maps for the plotter. You can set up the same thing:
- Make a project folder, such as
Precinct Maps, on your C: drive, OneDrive, or an external drive. - Put your office’s current precinct layer and polling place list in it. Those are the only files you supply. The AI gets the public layers itself.
- Open the folder in the Claude desktop app: Code tab, + New, then under the message box choose Local and Open folder…, and pick the folder. (Folder projects shows each step.)
- Say what you want, like the prompt below.
- Open the PDF it saves and check it the same way as step 10 above.
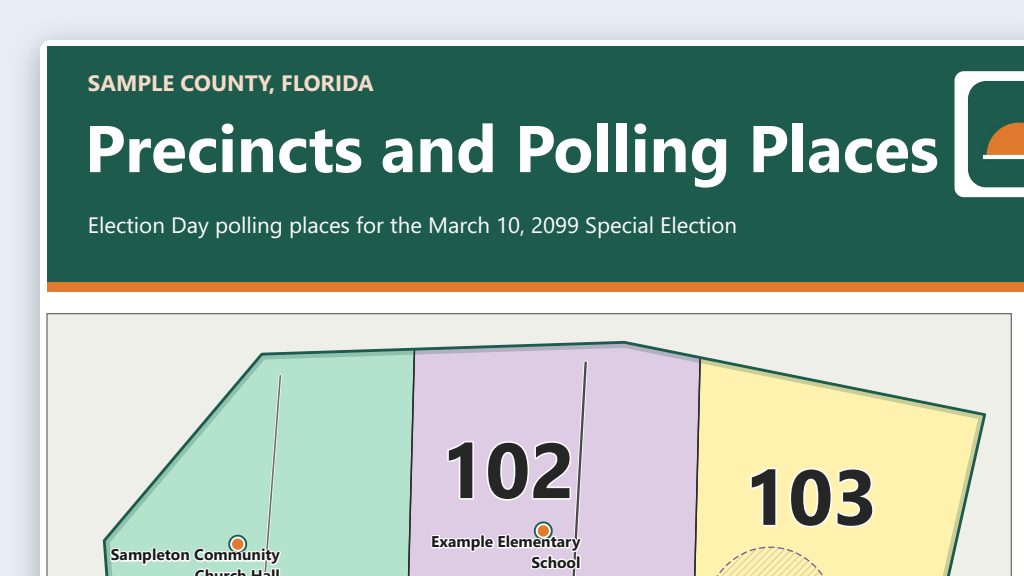 Example output
Say it or type it
Precinct map from public layers
Go to the Census Bureau's TIGER/Line page and download the newest roads and water files for [Your county] County, Florida. Our precinct layer and polling place list are already in this folder.

Use QGIS to make a letter-size PDF map: pale precinct fills with precinct numbers, numbered polling places, roads, and water. Put every layer in the same coordinate system as our precinct layer. Add a title, the map date, a legend, a north arrow, a scale bar, the sources, and the line "For reference, not an official boundary determination."

Save the map and the QGIS project in this folder, and tell me anything that didn't line up.
Fill in anything in [brackets] with your own details.
Once this one looks right, ask for a 36 × 48 inch version for the plotter in the same folder.
The Precinct and polling place maps use case goes further. When you’re ready for more, Which Tool for Which Job explains where Claude Code fits, and Going Further covers CLAUDE.md project files (a short instructions file the AI reads at the start of each session). A sample map built from public data will be posted in the Examples Gallery once it’s approved.